vROps VM Performance Investigation Dashboard

vROps

Goal – Revise https://vmscribble.com/vrops/vrops-6-create-dashboard-custom-views-text-scoreboards/ from Jan 2017 with vROps 8.10.2 (21178503)

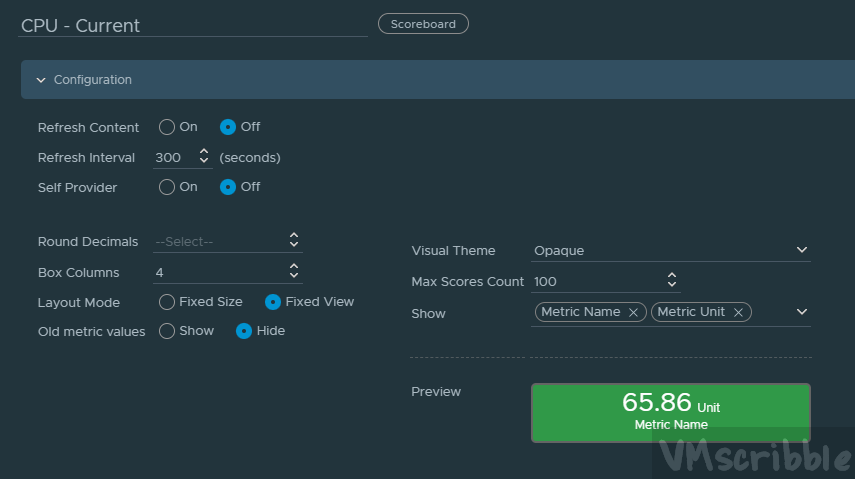
The user searches for a VM and the dashboard draws key CPU/MEM/Disk/Network metrics. The scoreboard widgets are color coded to alert the user.  ( The colors are set to low numbers to showcase the colors.)  The graph shows the last 24 hour for each metric to determine a trend or one-off spike; correlations.

You can see how the Interaction of the Dashboard Widgets is connected.  How the Views metrics are picked.  How the Scoreboard colors are setup.  This is much faster to review when you import the views and dashboard on the next tab “Download”.

The Views XML and Dashboard json can be found inside of this zip file.

https://vmscribble.com/x/vROps-VM-Performance-Investigation-Dashboard-vmscribble.com.zip