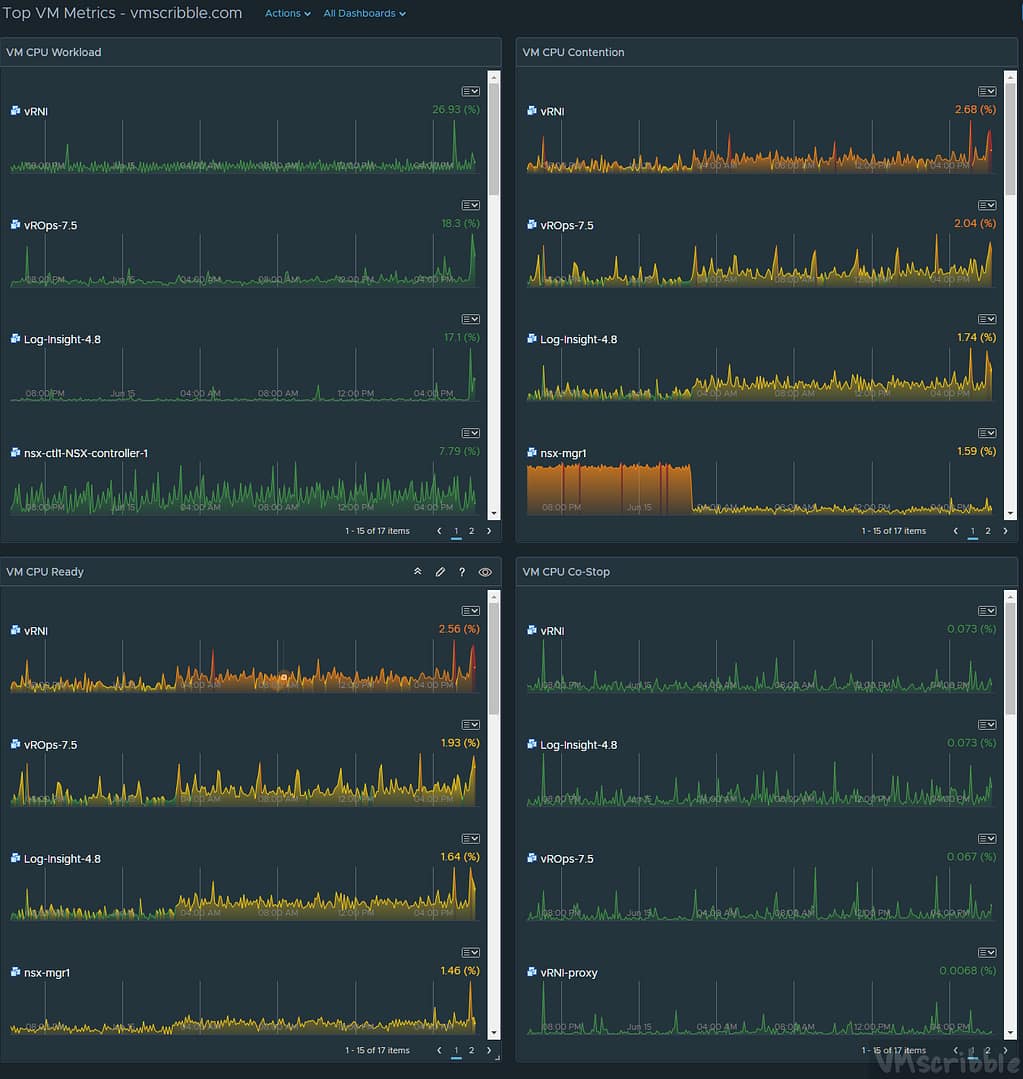
The dashboard is meant for a NOC wall that will show the top VM CPU Metrics ( Workload, Contention, Ready, Co-Stop). The colors are subjective. I like the health widget since it shows the past 24 hours to see of there is a trend up or a spike. The health widgets are sorts by the highest # on top.
vROps – vRealize Operations Manager – Version 7.5.0.13165949 Build 13165949
Direct URL to import the dashboard.
Create a new Dashboard with 4 Health Widgets/
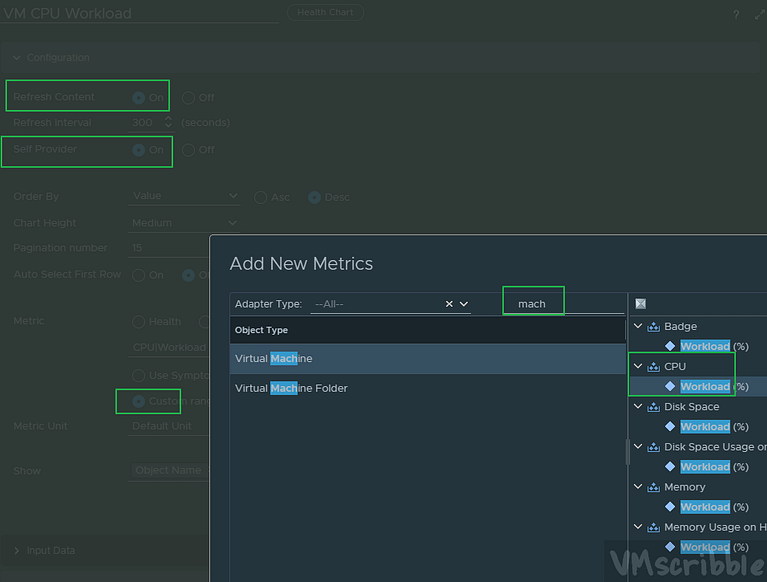
Refresh Content – On
Self Provider – On
Metric – Custom. Search for VM and CPU workload. (repeat for ready,contention and costop on the other widgets)
Custom Ranges – All subjects on how you want the #’s colored.
To show ALL VMs.
Output Filter-
- Object Types
- Virtual Machine
- The Scoop
-
The dashboard is meant for a NOC wall that will show the top VM CPU Metrics ( Workload, Contention, Ready, Co-Stop). The colors are subjective. I like the health widget since it shows the past 24 hours to see of there is a trend up or a spike. The health widgets are sorts by the highest # on top.
vROps – vRealize Operations Manager – Version 7.5.0.13165949 Build 13165949
Direct URL to import the dashboard.
- How-to
-
Create a new Dashboard with 4 Health Widgets/
Refresh Content – On
Self Provider – On
Metric – Custom. Search for VM and CPU workload. (repeat for ready,contention and costop on the other widgets)
Custom Ranges – All subjects on how you want the #’s colored.
To show ALL VMs.
Output Filter-
- Object Types
- Virtual Machine


