Aria Ops Resource Pool Super Metric for VM IOPS

vROps
  • Statement – VMware Cloud Director (VCD) creates Resource Pools per client.
  • Goal – Create a Dashboard and View in Aria Ops to list the IOPS used by the entire resoure pool (client) by ESXi cluster for a certain period of time.
  • Challenge – A Resource Pool object in VMware Aria Operations Version: 8.14.0 does not list any metrics for the VMs inside the resource pool.
  • Solution – Create a super metric per VM metric needed.

Search for a guest VM as normal and draw the metrics and or properties in scope. This will help to save time to copy/paste the metric name in Aria Ops.

In the 2 picked below, note the Units are not needed (KBps) since we will define that in the super metric.

Virtual Disk:Aggregate of all Instances|Total IOPS
Virtual Disk:Aggregate of all Instances|Total Throughput

Login to Aria Ops. Configure / Super Metrics

Side note – If not looking to create by hand, you can import both:
https://vmscribble.com/x/Supermetric-Total_Throughput-vmscribble.com.json

https://vmscribble.com/x/Supermetric-Total_IOPS-vmscribble.com.json

Add

  • Name – Total IOPS
  • Object Types – Resource Pool

Formula Tip = Paste as unformatted, then flip to formatted to syntax highlight it.

avg(${adaptertype=VMWARE, objecttype=VirtualMachine, metric=virtualDisk:Aggregate of all instances|commandsAveraged_average, depth=1})
  • Click Validate.
  • Click Preview and added a few Resource Pools to ensure the metric is drawn.

Policies:
Check the box under Resource Pool.
Note – We are using the out of the box “vSphere Solution’s Default Policy” since this is a home lab. In production, it is best practice to create a new Policy.
Click Create.

Create a 2nd super metric for Virtual Disk:Aggregate of all Instances|Total Throughput

avg(${adaptertype=VMWARE, objecttype=VirtualMachine, metric=virtualDisk:Aggregate of all instances|usage, depth=1})

Set the Unit to: MBps

Create a View.  Visualize / Views / Create

Side note – link (saved as) to import https://vmscribble.com/x/View-Resource_Pool_Disk_Metrics-vmscribble.xml

  • Click List.
  • Subject – Resource Pool
  • Add (drag and drop)
    Super Metrics|Total Throughput
    Super Metrics|Total IOPS
  • Metric Label – Remove the “Super Metrics|” prefix
  • Preview Source – I picked an entire vCenter to see all the RP’s and numbers.
  • Relative Date Range – Set to 1 Day since there is less then a day’s worth of this new SM collecting.

Create a Dashboard. Visualize / Dashboards / Create
Drag “Object List” and “List” View.

Object List
Edit the name to “Pick a vCenter”
Self Provider – On
Input Data – Objects – Added 3 vCenter.

Back on the widget screen, click on the lower left icon and only check off the “Name” to keep the widget clean.
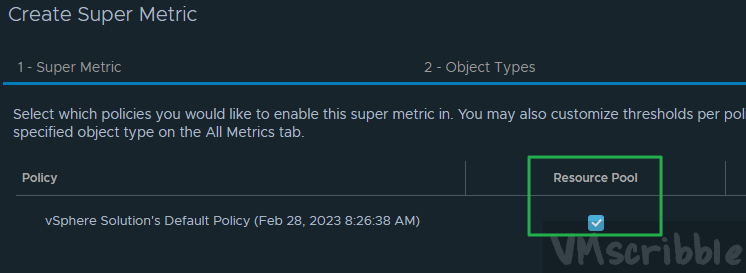
New List view
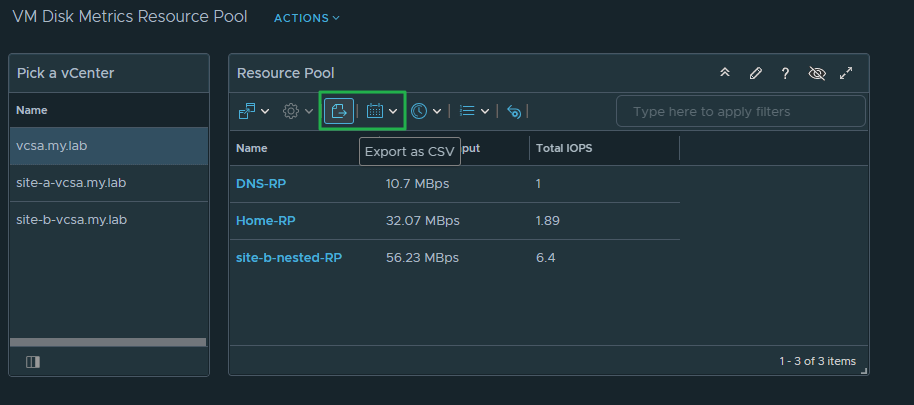
Edit the name. Ex. Resource Pool
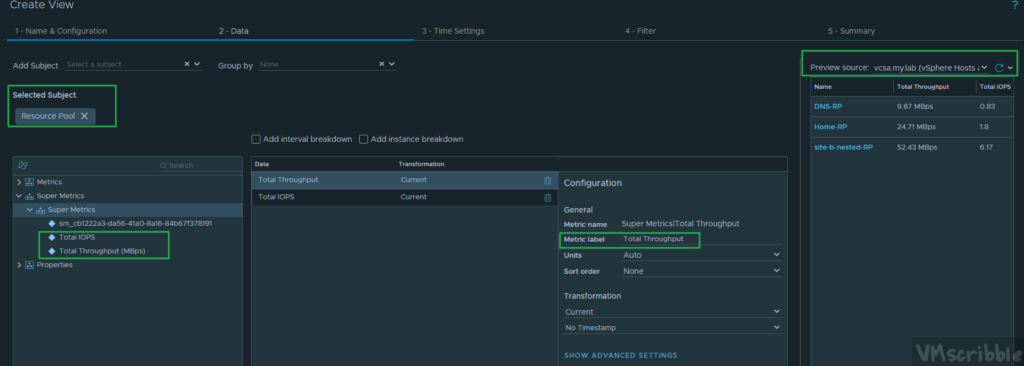
Search for the View from the last section.
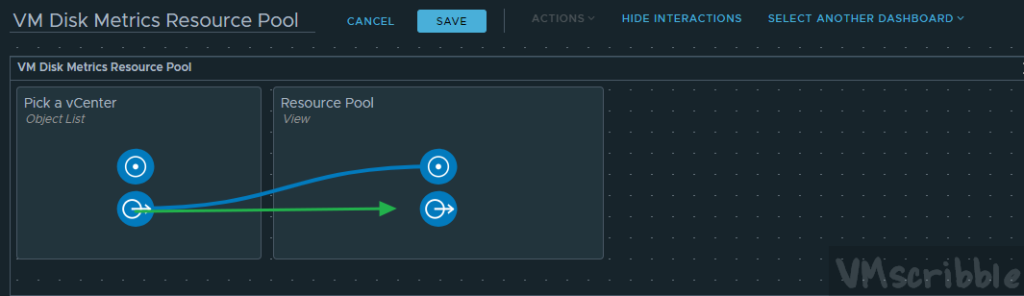
Show Interactions
Drag the “Pick a vCenter” icon to the Resource Pool.

When you pick the vCenter, the View is filled in with the metrics in scope.
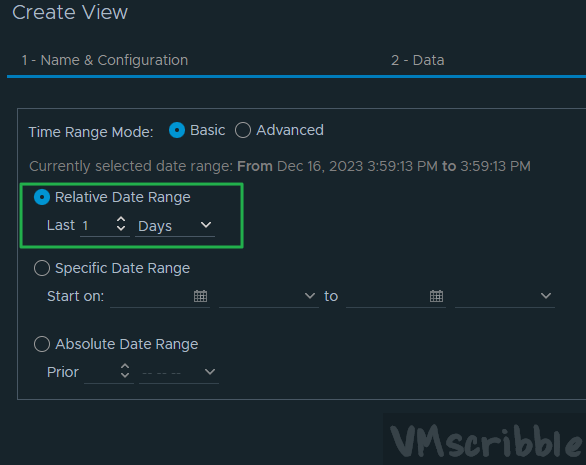
You can export the metrics to a CSV and change the time frame.
Since this is a View, report an be created each day/week/month depending on the use case.